
Color-Coded Cryptocurrency Price Charts in Python
Color can add useful context to a price chart when it encodes a defined quantity rather than decoration. This updated tutorial colors each line segment by the corresponding daily return using current pandas and Matplotlib APIs.
Prepare price and return data
The notebook uses a deterministic Bitcoin-like fixture so the full example runs without an exchange API. Replace market with a validated price series when adapting it.
market["return_1d"] = market["BTC_USD"].pct_change()Draw colored line segments
points = np.column_stack([x_values, y_values]).reshape(-1, 1, 2)
segments = np.concatenate([points[:-1], points[1:]], axis=1)
collection = LineCollection(segments, cmap="RdYlGn", norm=normalization)
collection.set_array(return_series.iloc[1:].to_numpy())
axis.add_collection(collection)
The color scale is symmetric around zero and clipped to the 98th percentile of absolute returns so one extreme value does not flatten the rest of the palette.
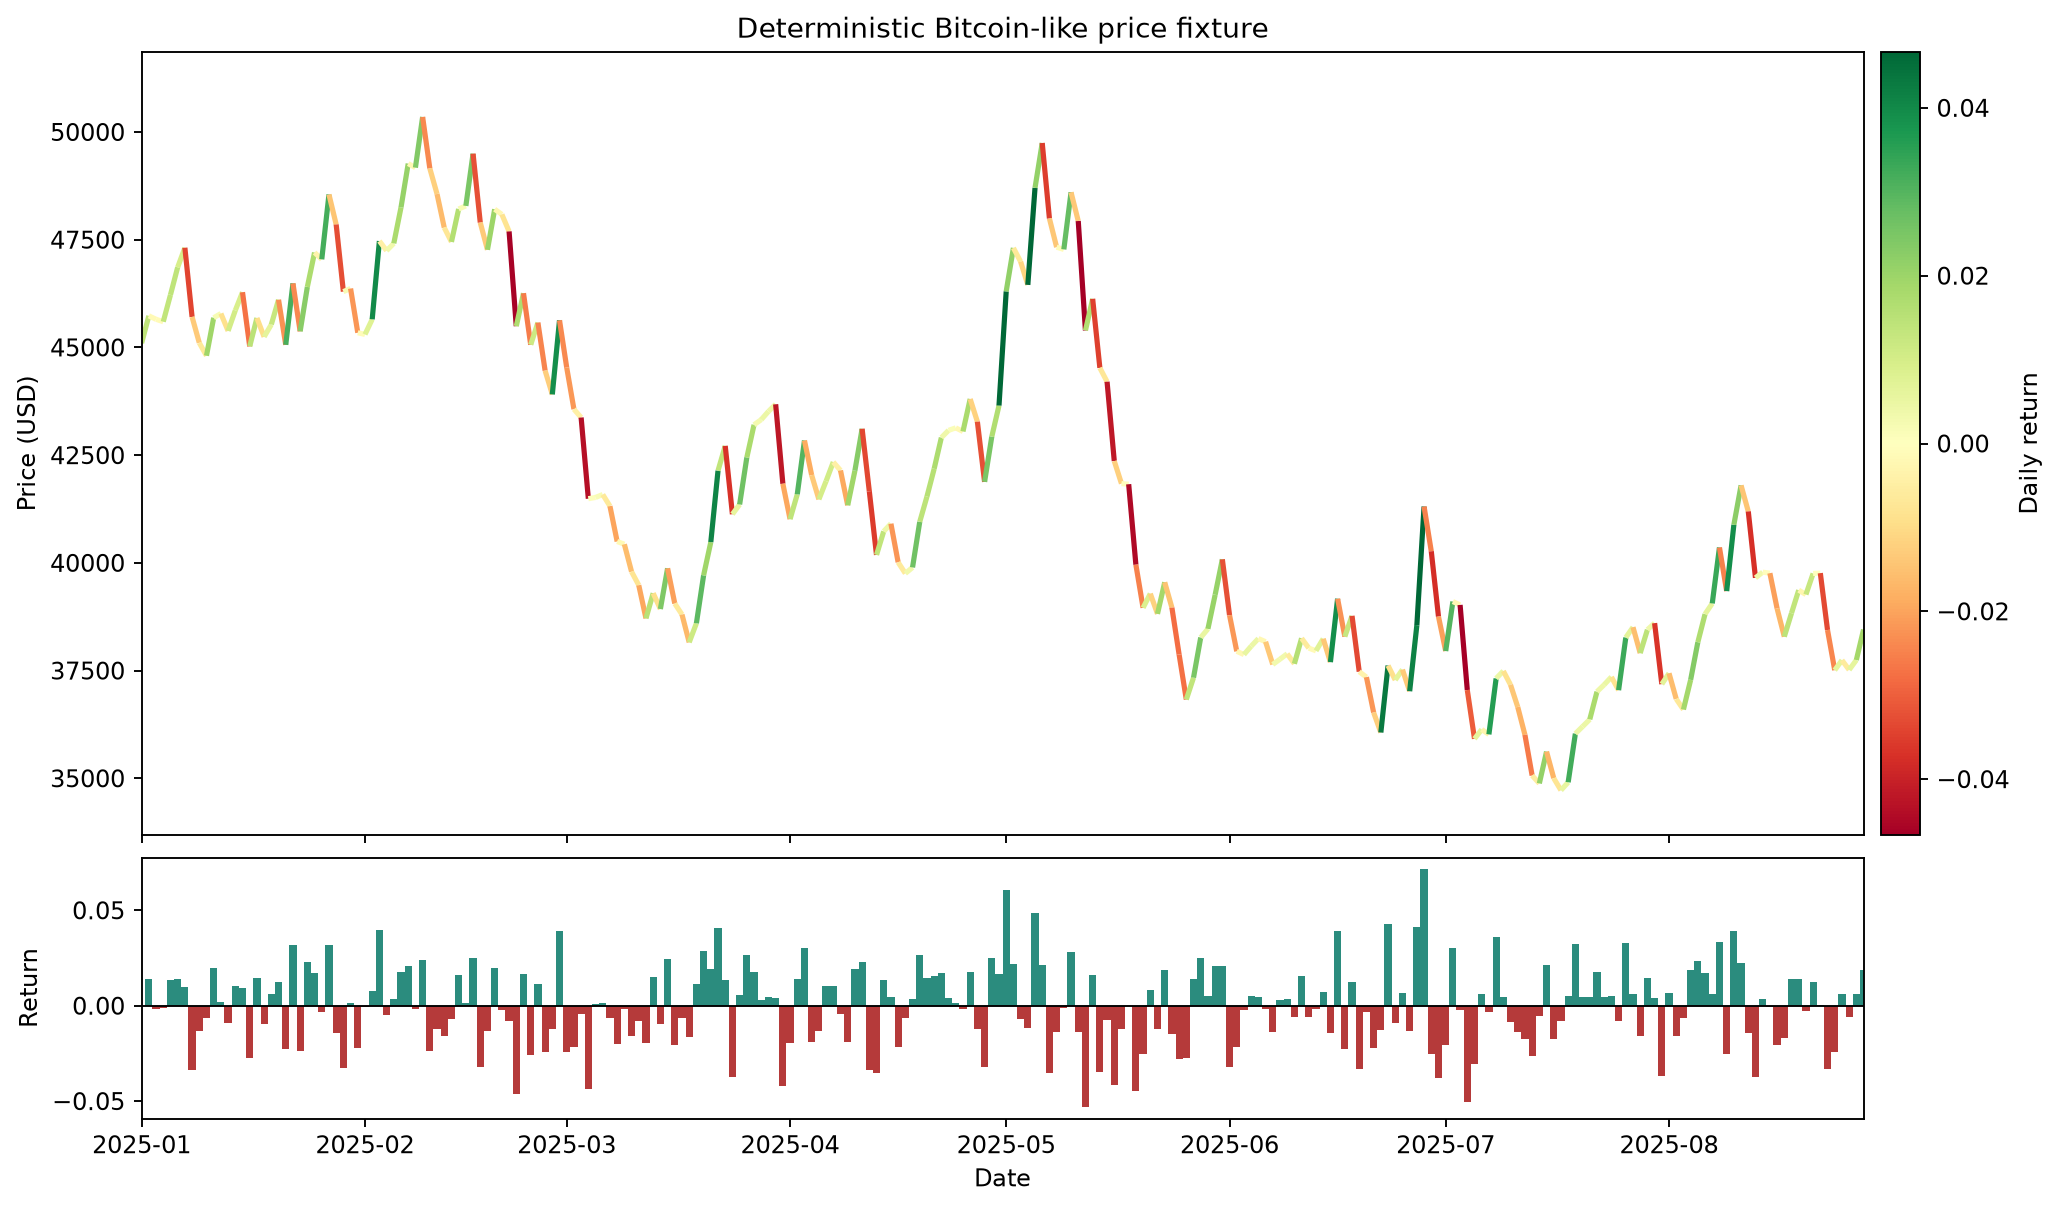
Color does not make the chart predictive. Always label the encoded measure, provide a colorbar, consider color-vision accessibility, and avoid treating a simulated fixture as market evidence.