
Correlation Matrix in Python: How Correlated are COVID-19 Cases and Different Financial Assets?

Correlation matrices provide a compact overview of pairwise association. This updated tutorial compares daily health-activity changes with financial-asset returns using both Pearson and Spearman correlation. The example is deterministic and designed to teach the method, not to estimate historical pandemic effects.
Use changes rather than price levels
Correlating trending cumulative cases and asset price levels can produce misleading relationships. The notebook works with daily growth and returns instead.
pearson = changes.corr(method="pearson")
spearman = changes.corr(method="spearman")
Pearson correlation measures linear association. Spearman correlation works on ranks and captures monotonic association with less sensitivity to extreme magnitudes.
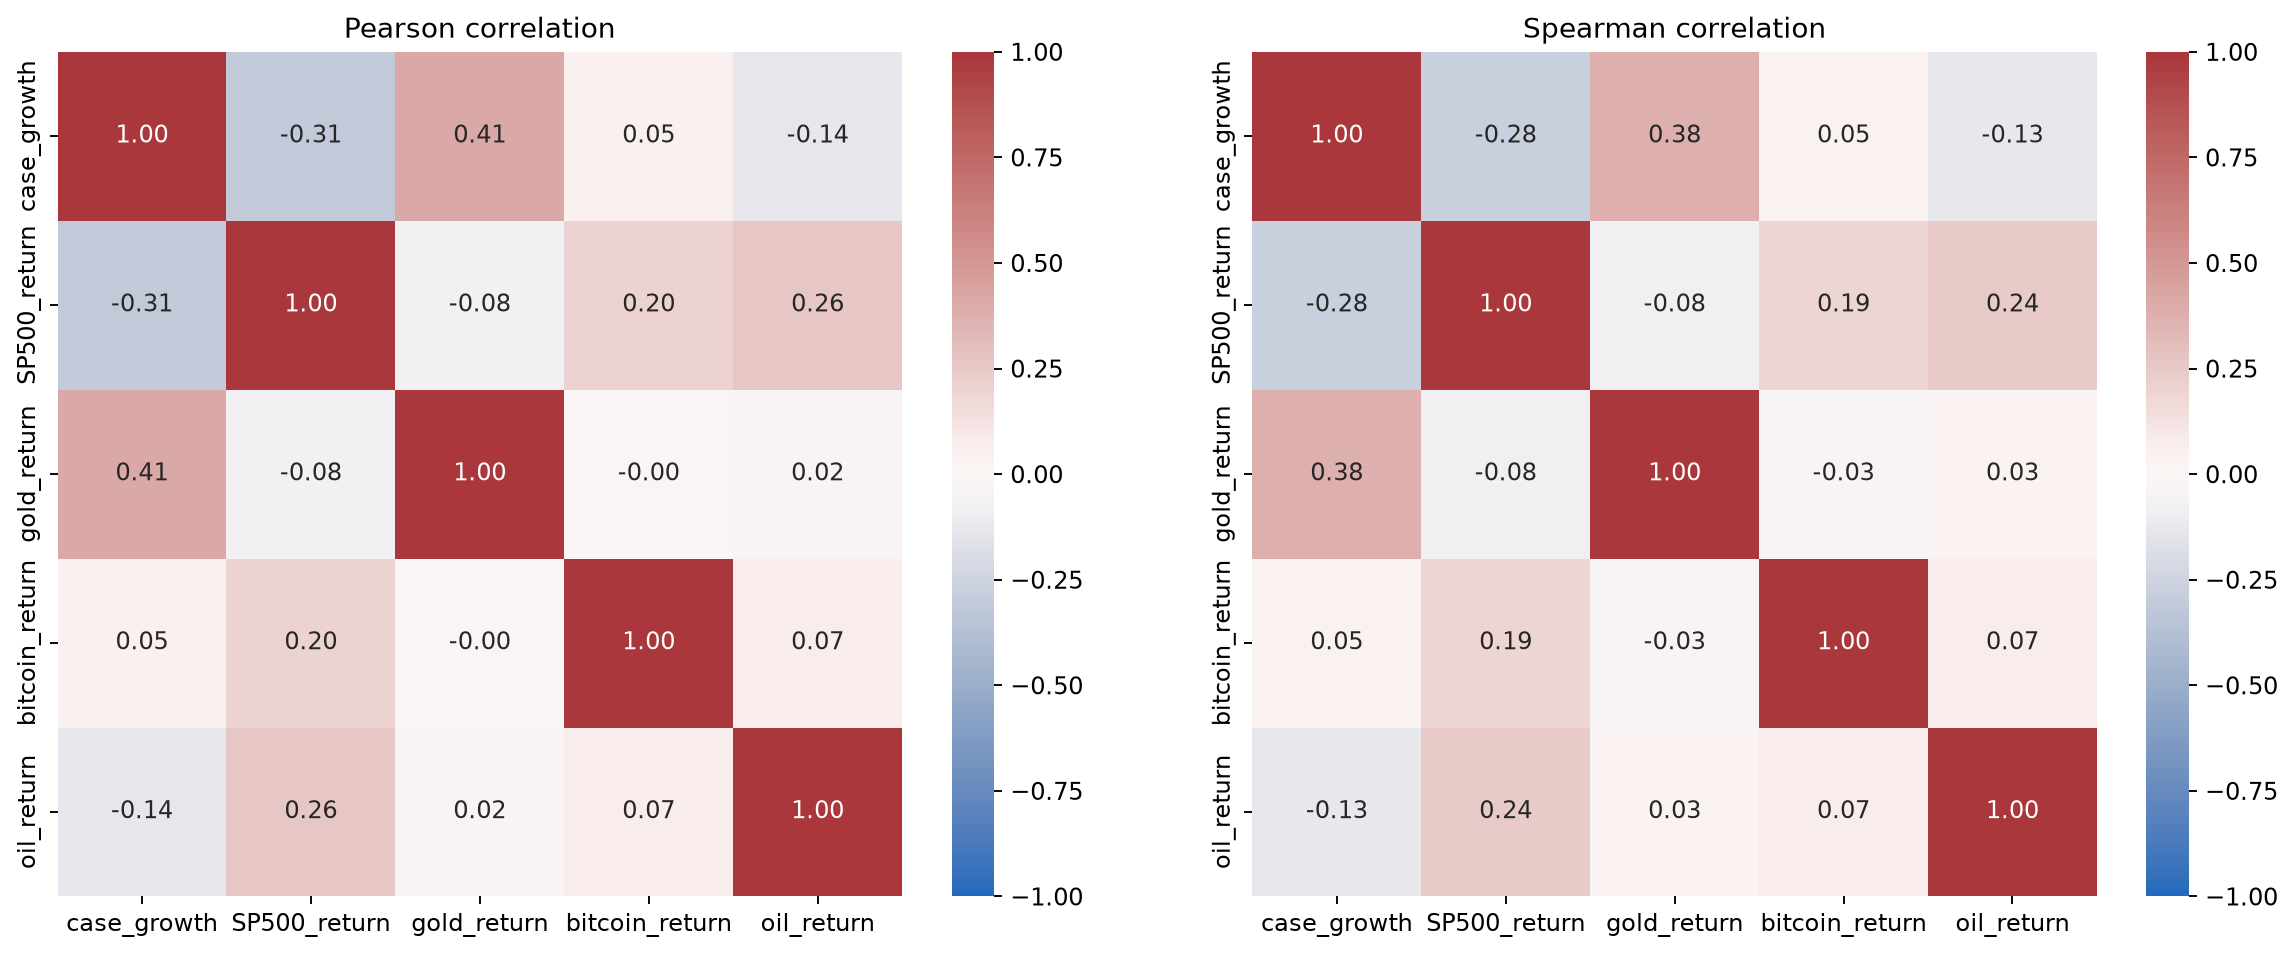
sns.heatmap(
    matrix,
    annot=True,
    fmt=".2f",
    cmap="vlag",
    center=0,
    vmin=-1,
    vmax=1,
)
Correlation does not establish causation. Real health and market data require aligned calendars, reporting-lag treatment, robustness checks across periods, correction for multiple comparisons, and a causal design before making policy or investment claims.



3 Commentsarchived from the original site