
Cluster Analysis with k-Means in Python

K-means partitions observations into a chosen number of clusters by minimizing within-cluster squared distance. This updated tutorial uses a deterministic two-dimensional fixture, standardization, silhouette analysis, and a fixed random seed.
Prepare and scale the data
features = make_blobs(..., random_state=RANDOM_SEED)[0]
scaled_features = StandardScaler().fit_transform(features)
Scaling matters because K-means uses Euclidean distance. A feature measured on a larger numeric scale would otherwise dominate the result.
Compare candidate cluster counts
The notebook fits several values of k, records inertia and silhouette score, then visualizes the selected clustering.
model = KMeans(n_clusters=k, n_init="auto", random_state=RANDOM_SEED)
labels = model.fit_predict(scaled_features)
score = silhouette_score(scaled_features, labels)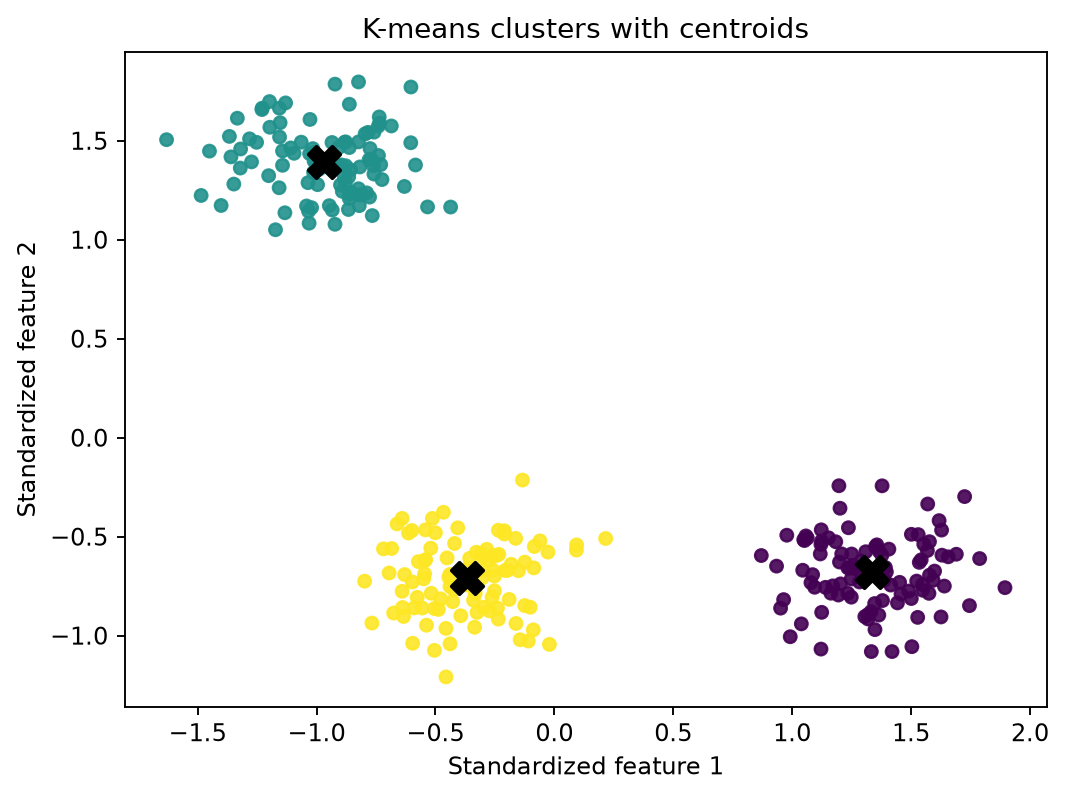
The highest silhouette score is a useful diagnostic, not a guarantee that clusters are meaningful. Domain interpretation, stability across samples, alternative distance assumptions, and sensitivity to outliers should also be checked.