Geographic Choropleth Maps with GeoPandas and Python
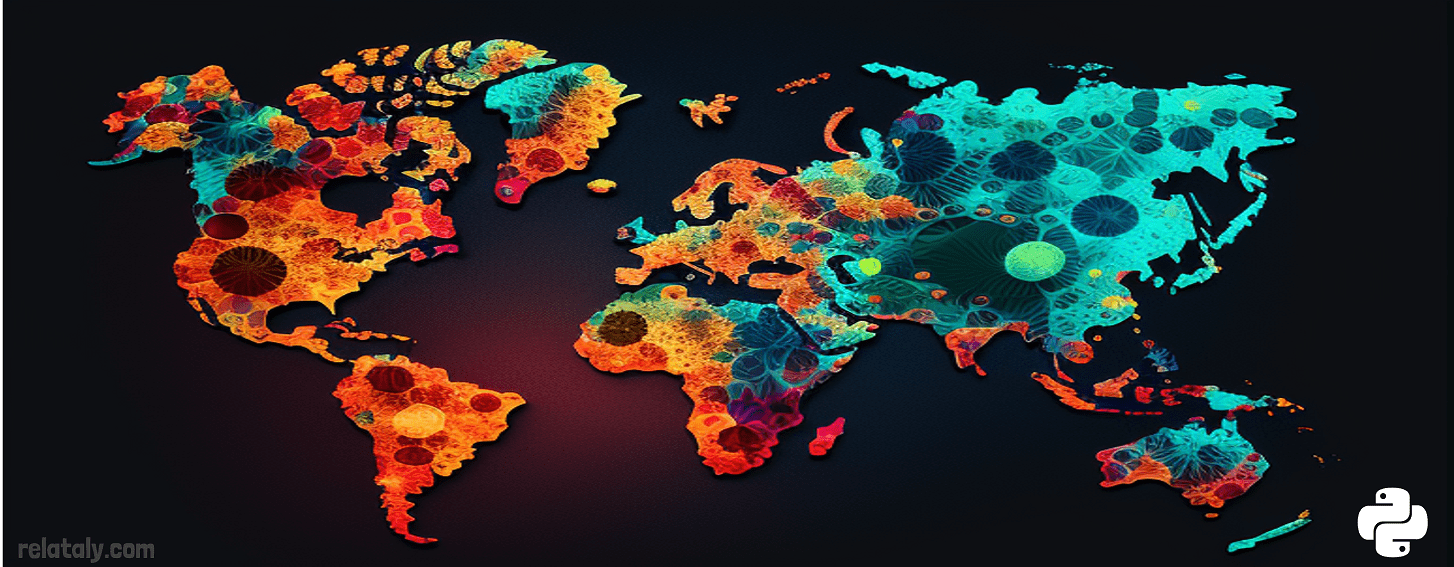
Build reproducible world and regional choropleth maps with GeoPandas, Natural Earth boundaries, and an archived COVID-19 dataset.
3 tutorials
Build reproducible world and regional choropleth maps with GeoPandas, Natural Earth boundaries, and an archived COVID-19 dataset.
COVID-19 has had a strong impact on the global stock market. We can measure this influence with a stock market correlation matrix in Python.
This article shows how to access remote data sources via REST APIs in Python. Two examples are given: Using Pandas Webreader and Requests.